Interface Tour
This guide walks you through the main areas of UserLens Insights so you can navigate with confidence.
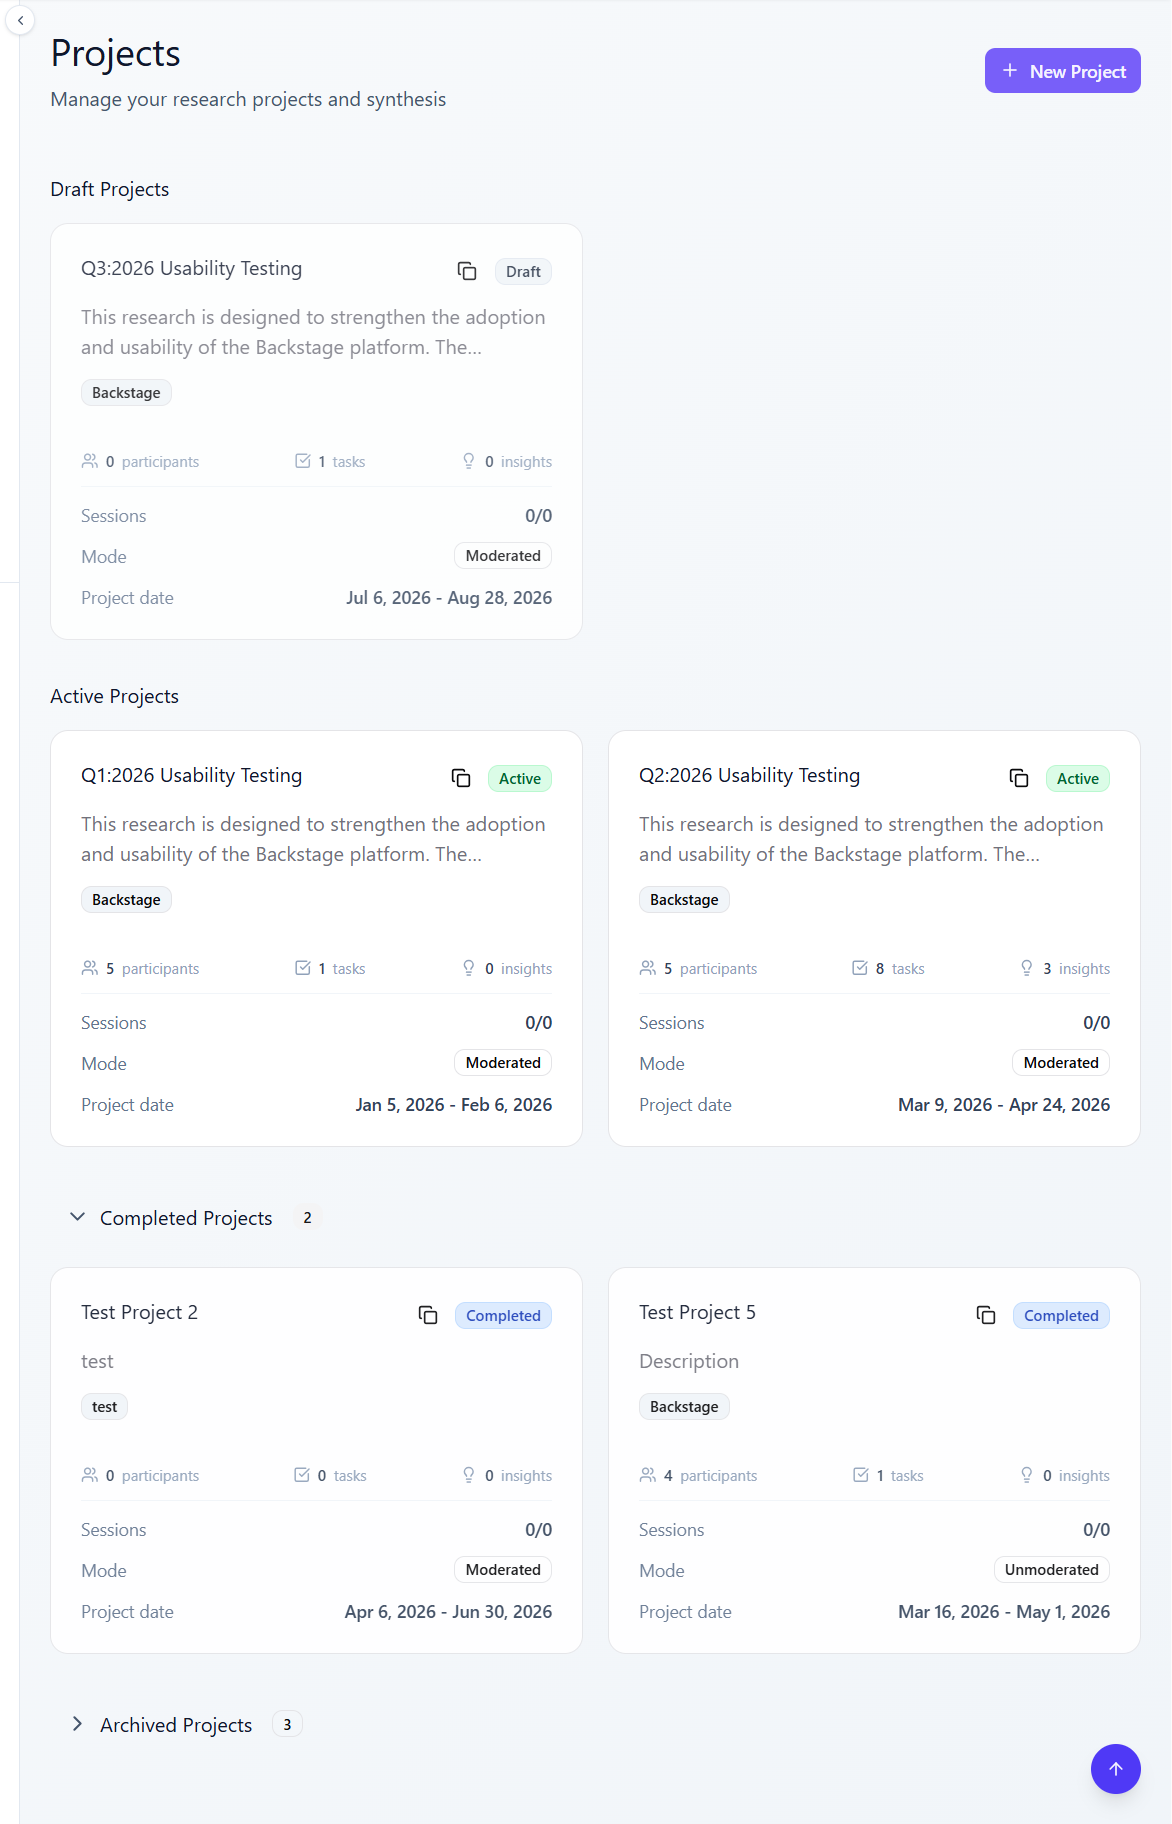
Dashboard
The dashboard is your home base. It shows all your projects at a glance.
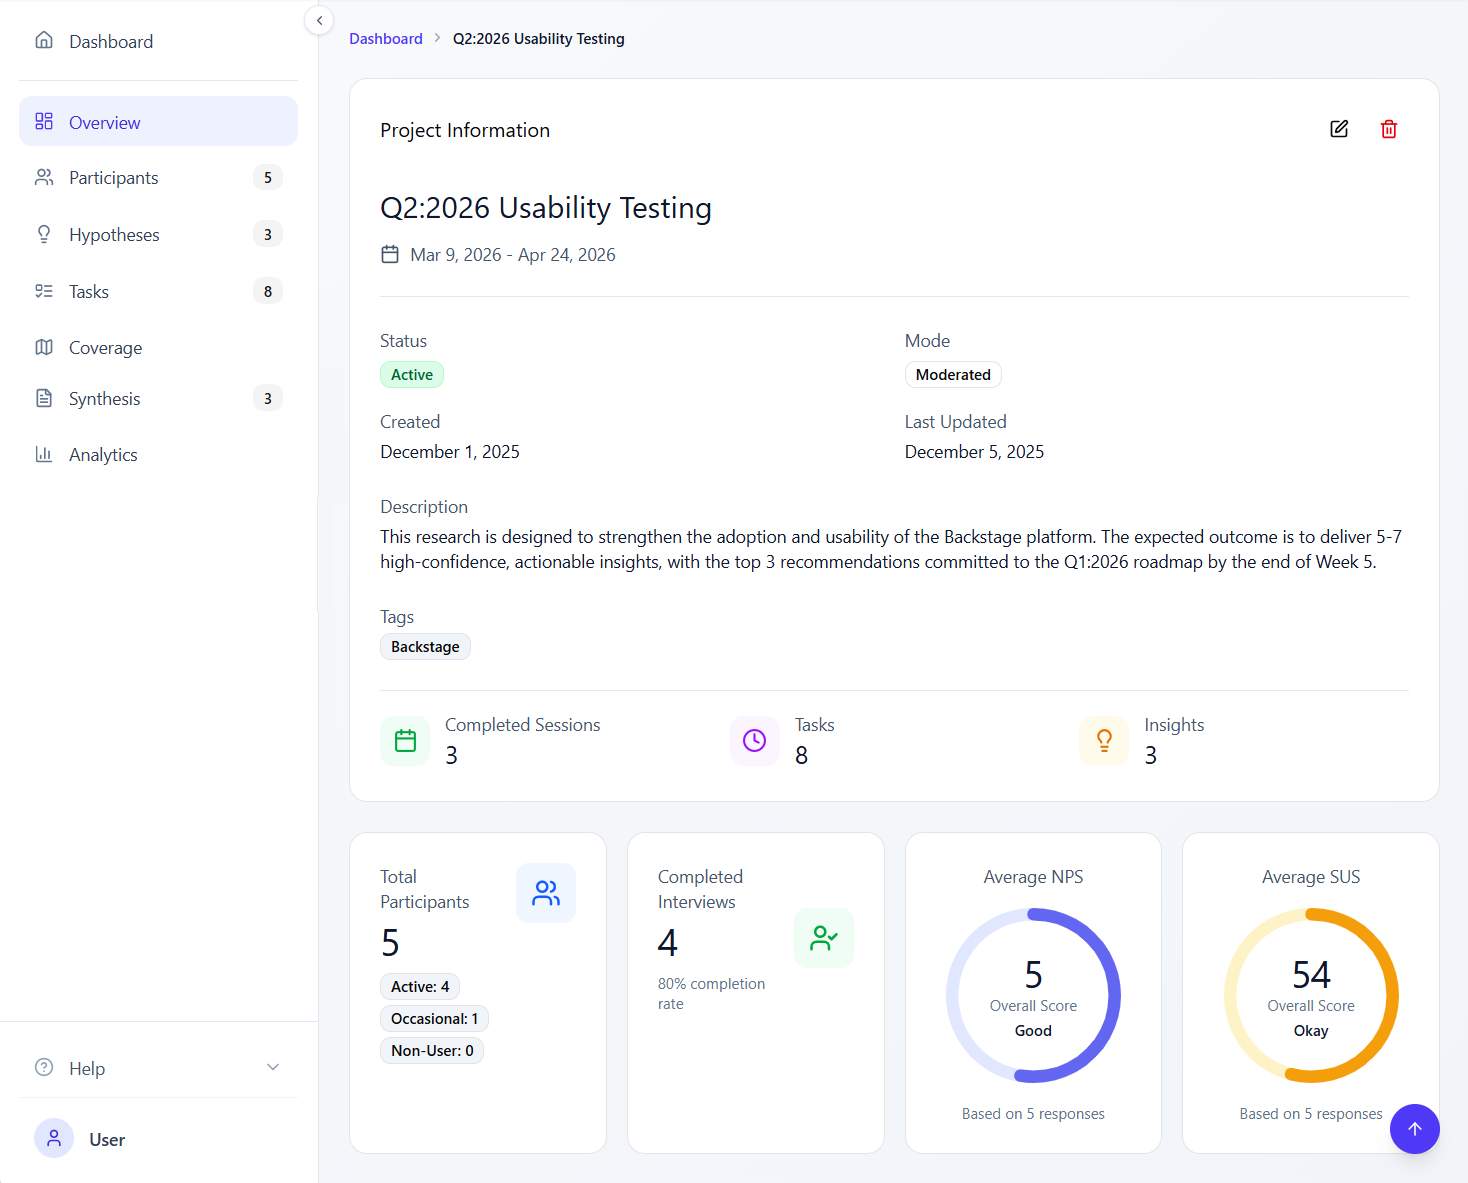
Project View
Click a project to open its detail view. The left sidebar shows project tabs.
| Tab | What It Shows |
|---|---|
| Overview | Project settings, research goals, status, and summary stats |
| Participants | All participants with scheduling, status, and session details |
| Hypotheses | Research hypotheses with status, priority, and evidence |
| Tasks | Task list with difficulty, questions, and hypothesis links |
| Coverage | Matrix showing hypothesis-task coverage and alignment issues |
| Synthesis | Research questions, sticky notes, and clusters |
Participants Tab
Manage your research participants and their sessions.
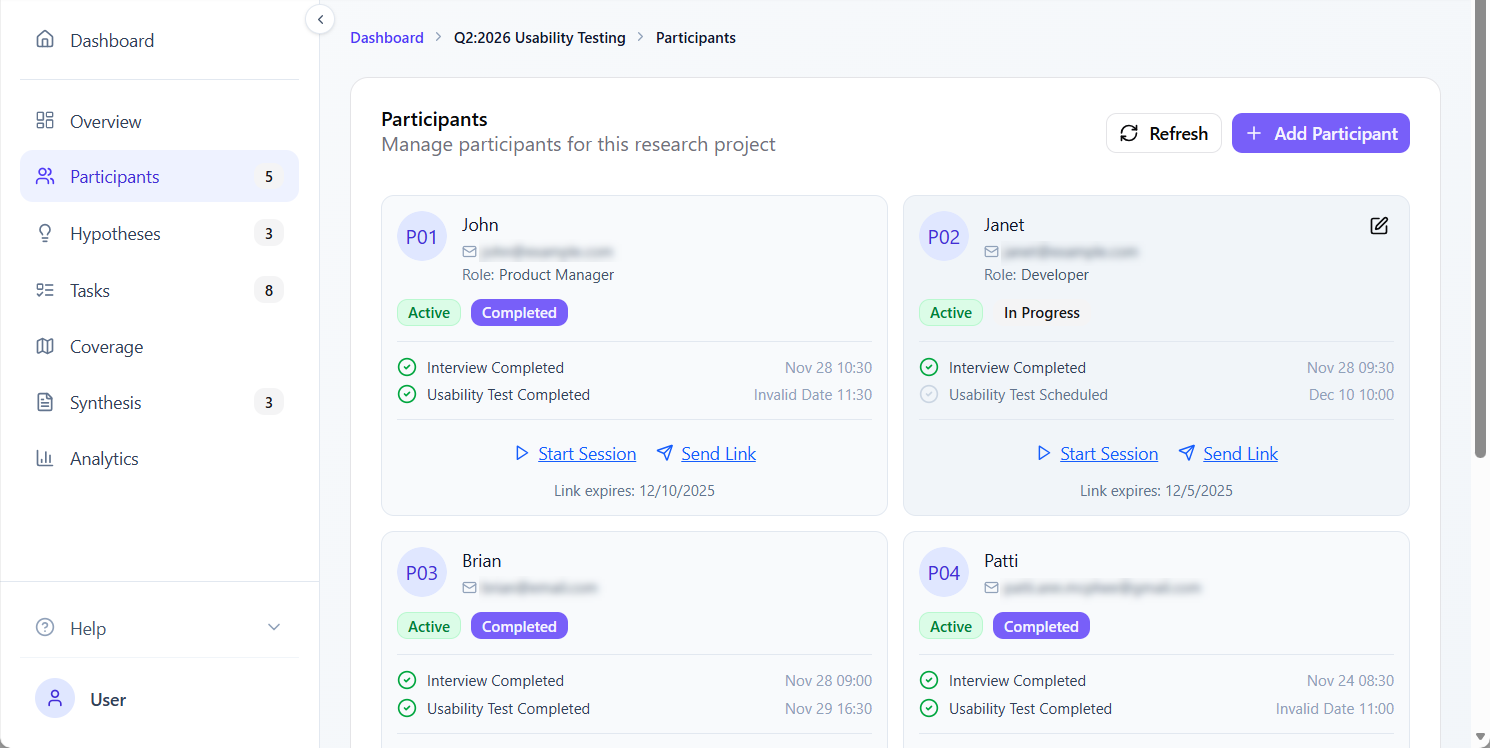
Participant card shows:
- Name and contact
- Usage level and role
- Scheduled session date/time
- Completion status
- NPS/SUS scores (if collected)
Actions:
- Edit: Update details, schedule sessions, mark complete
- Delete: Remove participant from project
- Import: Bulk import from CSV
Tasks Tab
Create and manage research tasks.
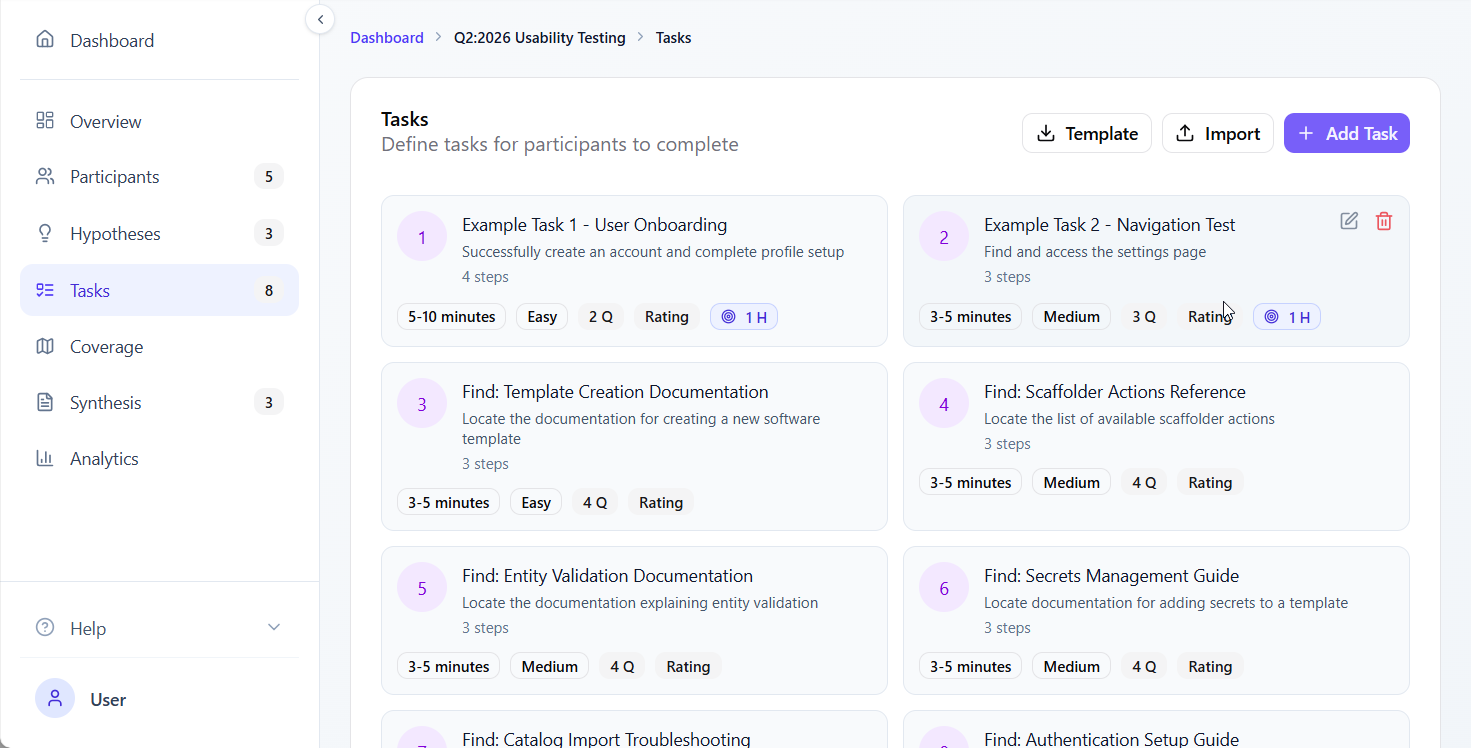
Task card badges:
- Time estimate: How long the task should take
- Difficulty: Easy, Medium, Hard, or All Users
- Q: Number of follow-up questions
- Rating: Task rating scale is enabled
- 🎯 H: Number of linked hypotheses
Synthesis Tab
Capture and organize research findings.
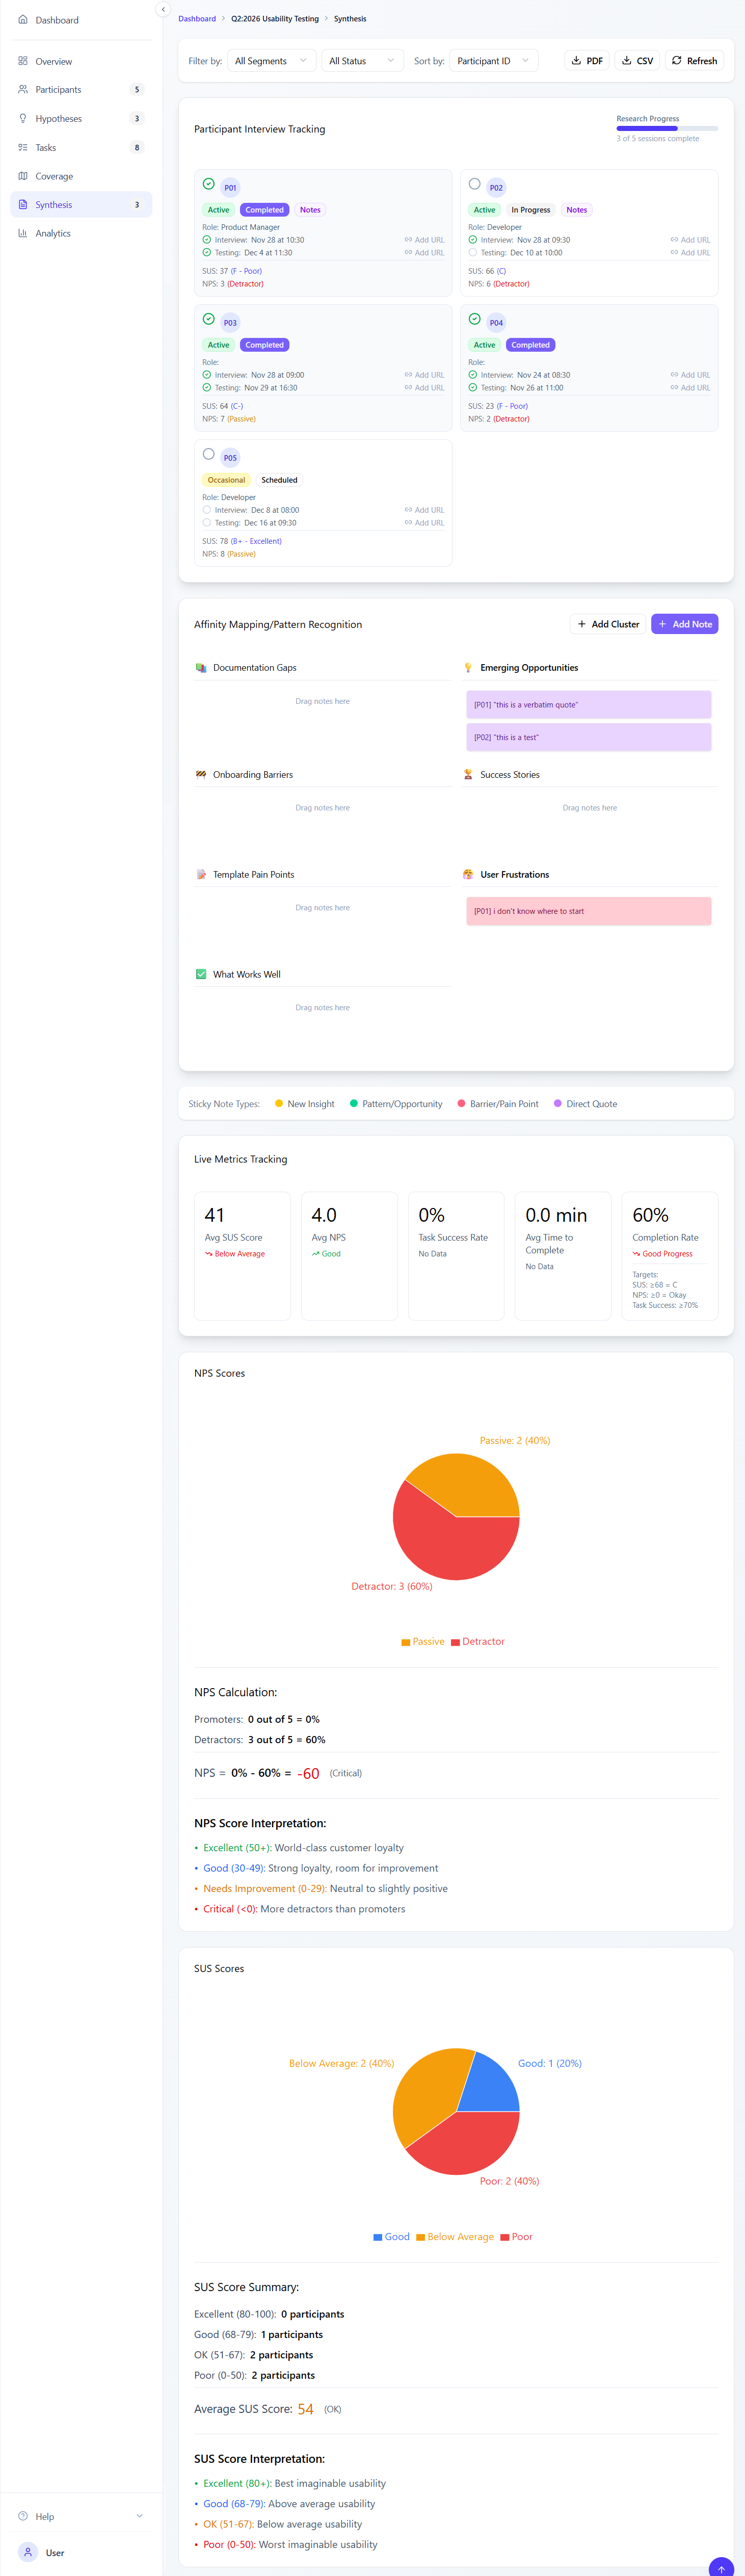
Sticky note types:
- 🔴 Barrier: Problems and friction points
- 🟡 Insight: Observations and patterns
- 🟢 Opportunity: Ideas and improvements
- 🔵 Quote: Direct participant quotes
Clusters: Group related notes by dragging them together
Hypotheses Tab
Track and validate research hypotheses.
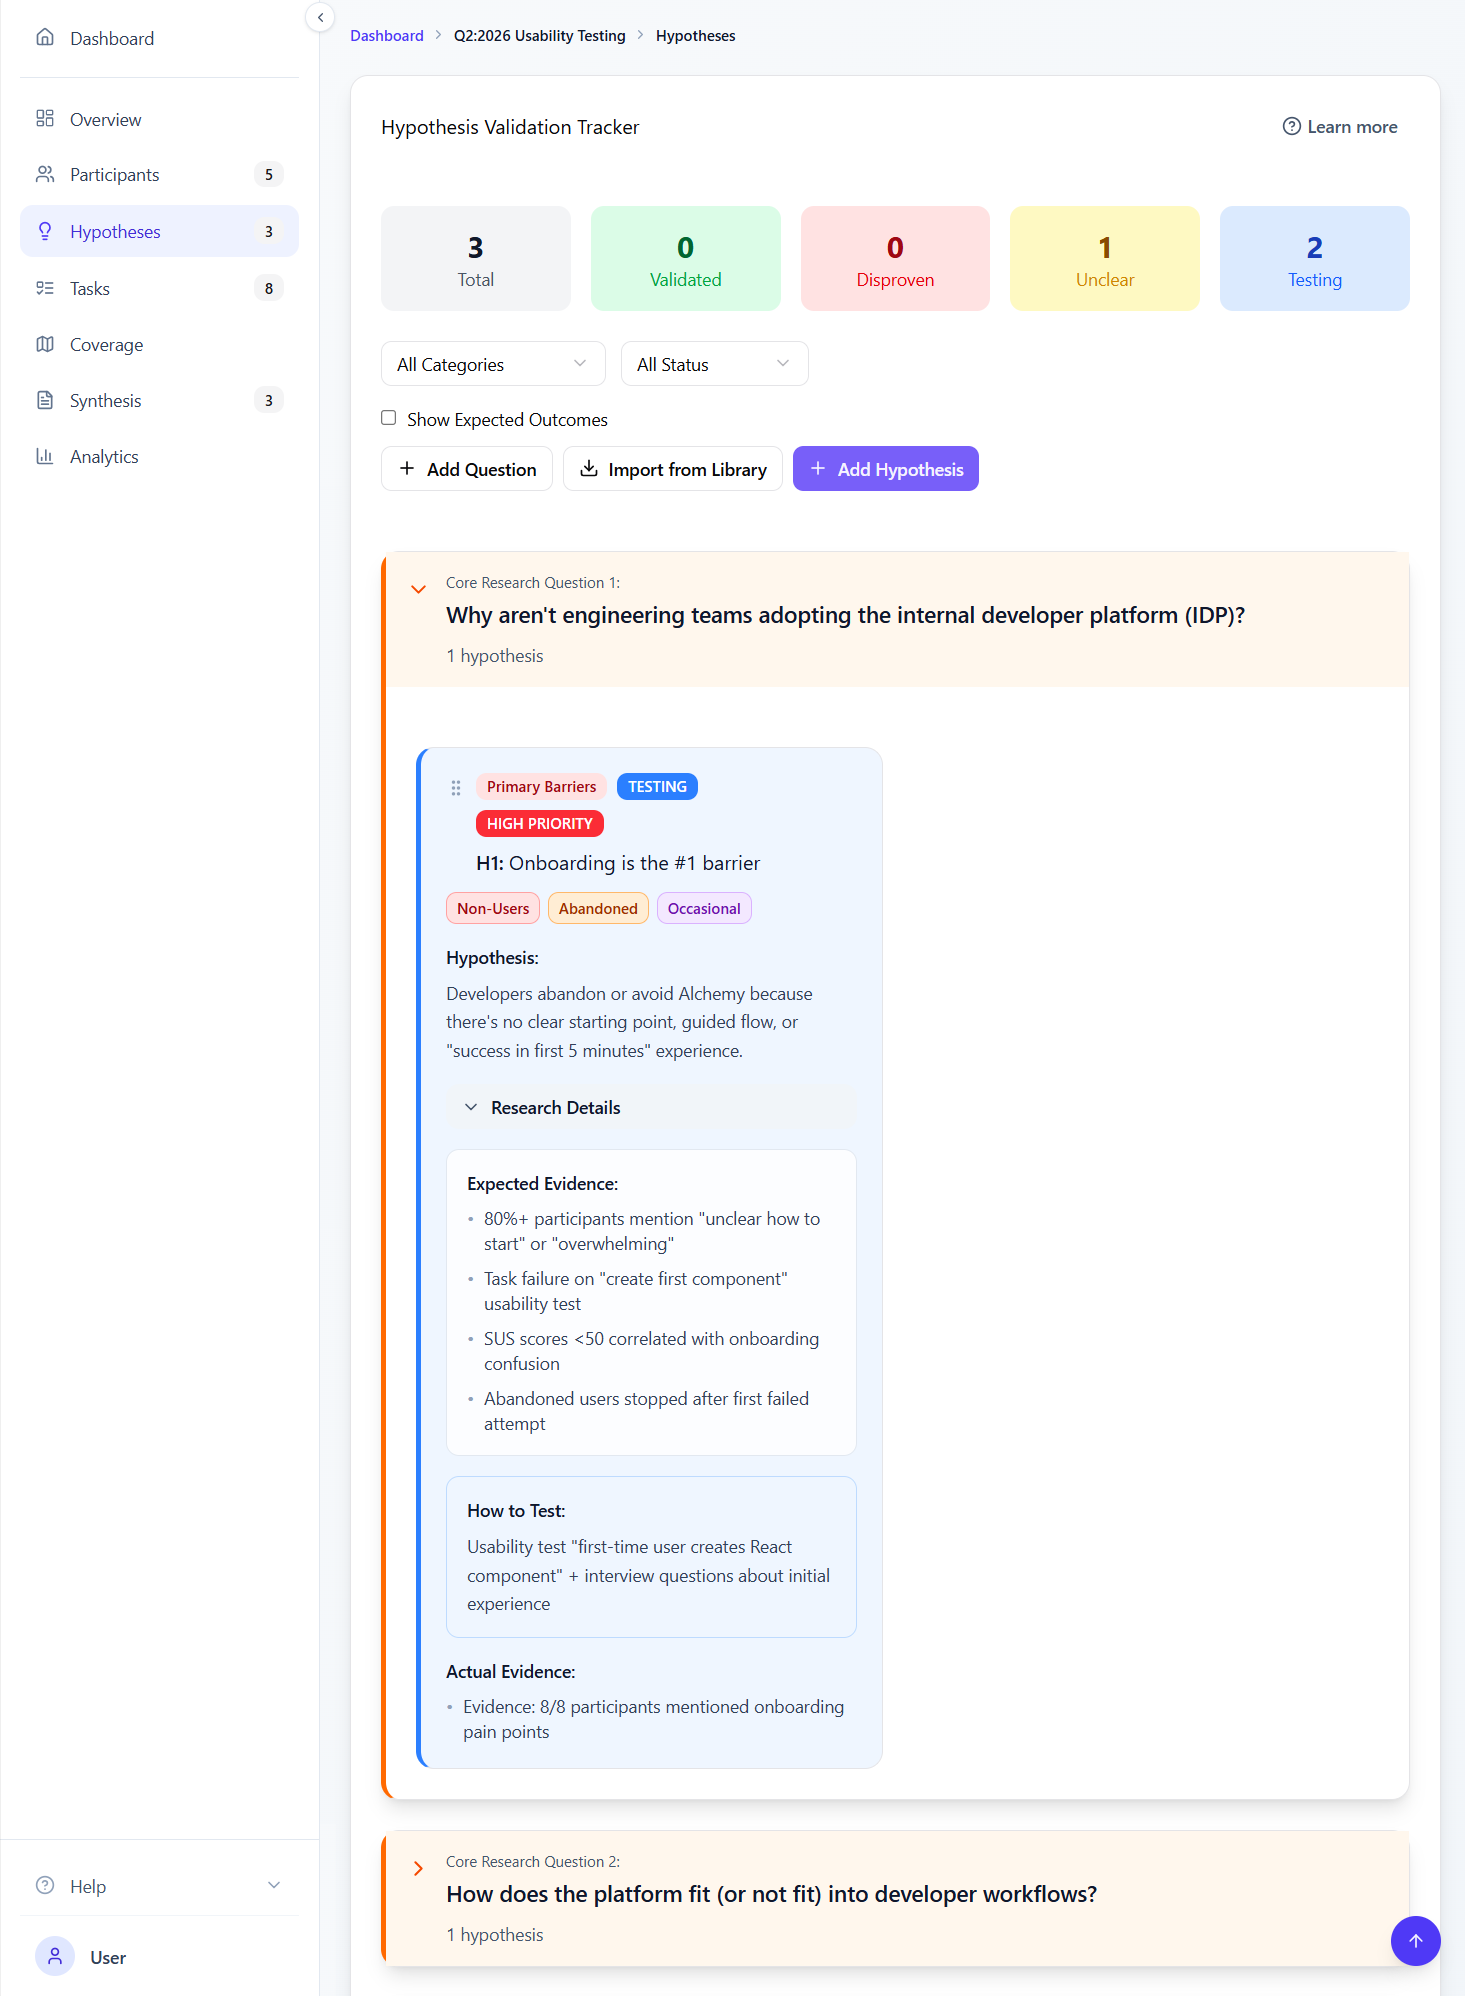
Status indicators:
- Testing: Currently being evaluated
- Validated: Evidence supports the hypothesis
- Disproven: Evidence contradicts the hypothesis
- Unclear: Insufficient or mixed evidence
Coverage Tab
Visualize how well your tasks cover your hypotheses.
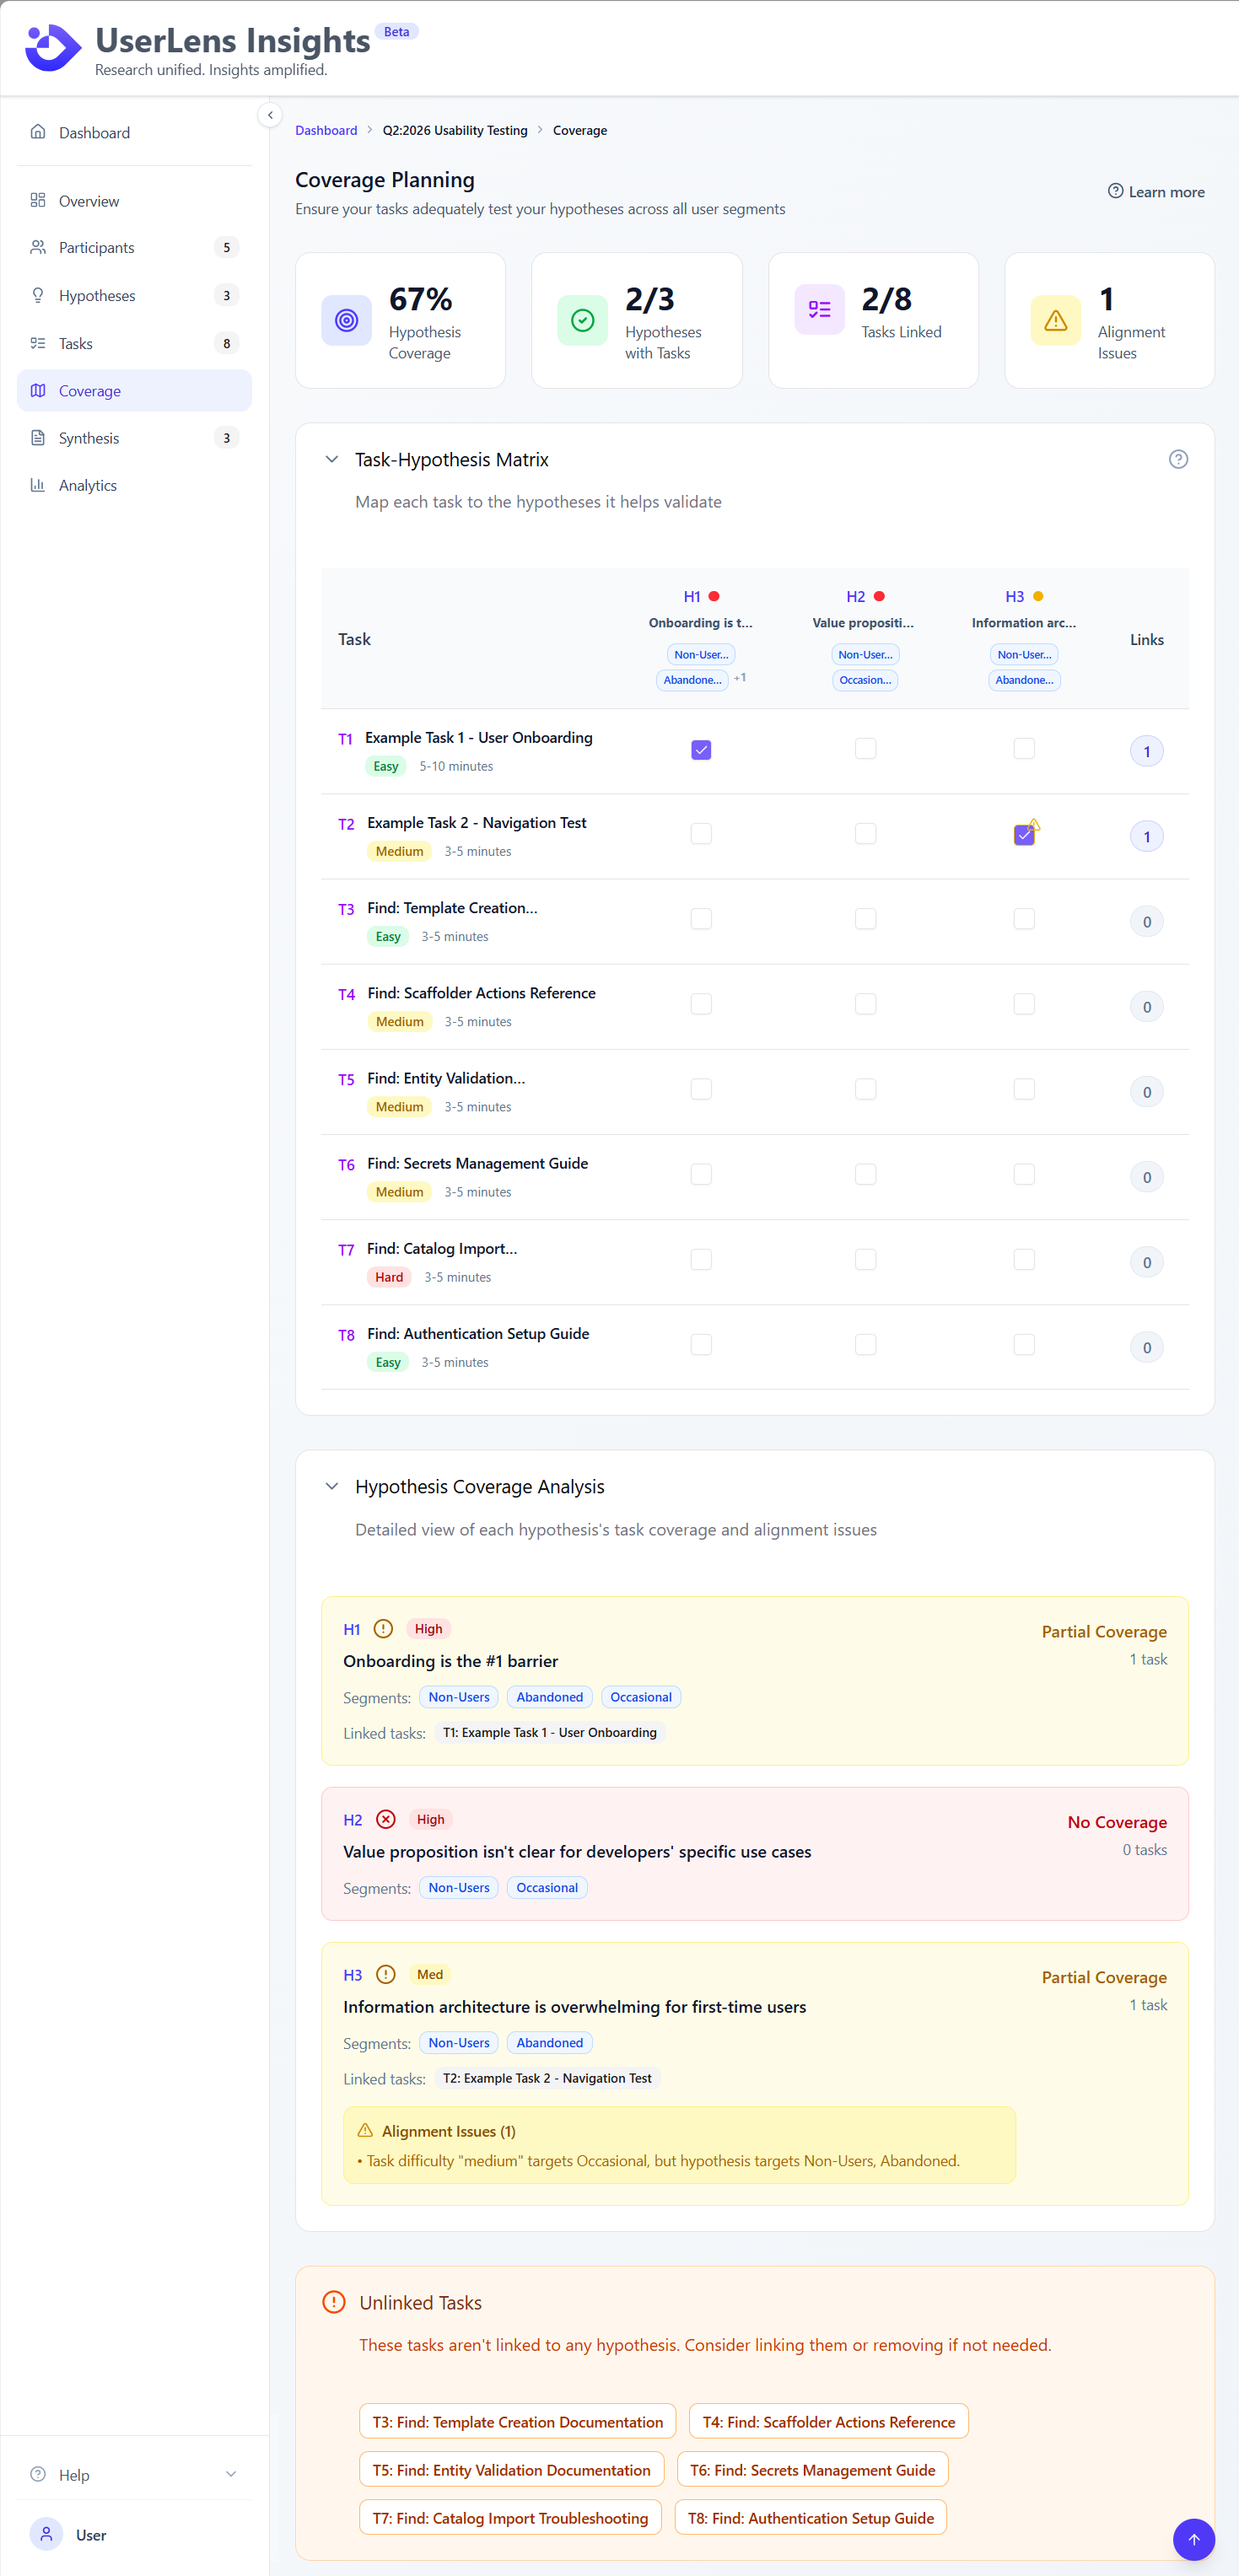
What to look for:
- Empty rows: Hypotheses with no tasks (gaps)
- Empty columns: Tasks not linked to hypotheses (orphaned)
- ⚠ Warnings: Task difficulty doesn't match hypothesis segments
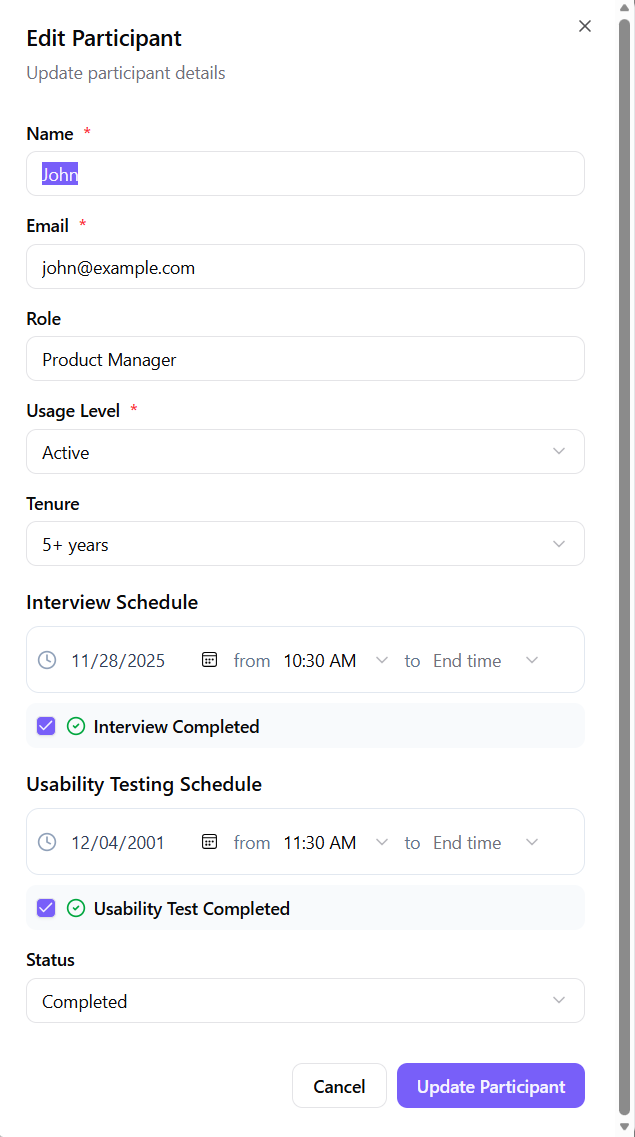
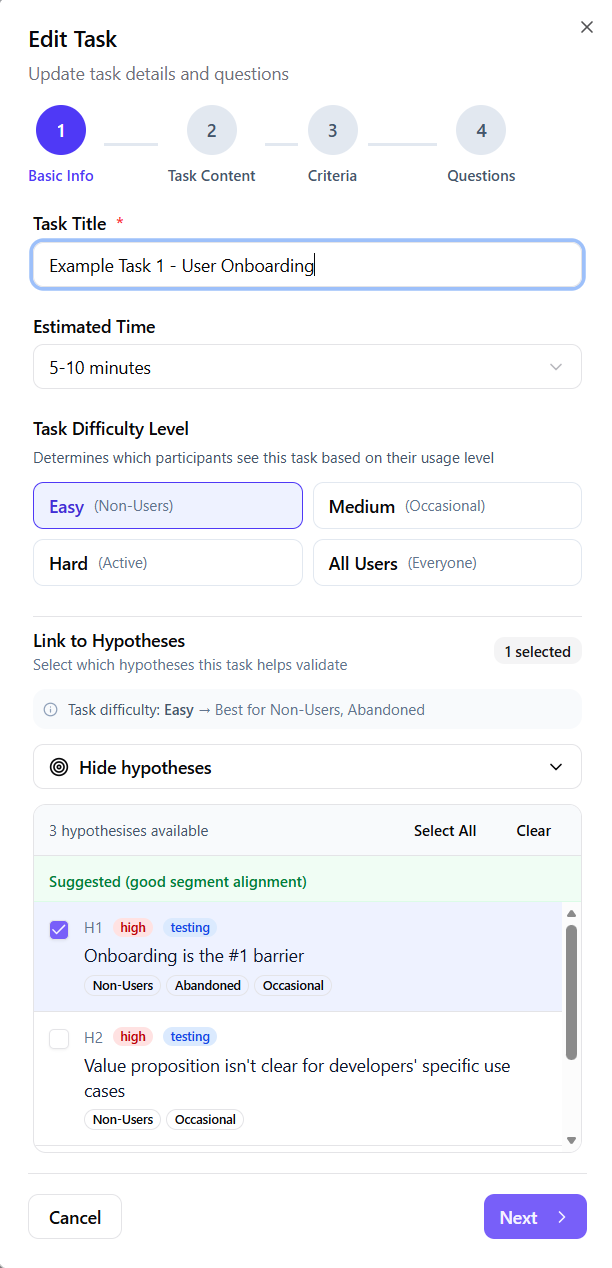
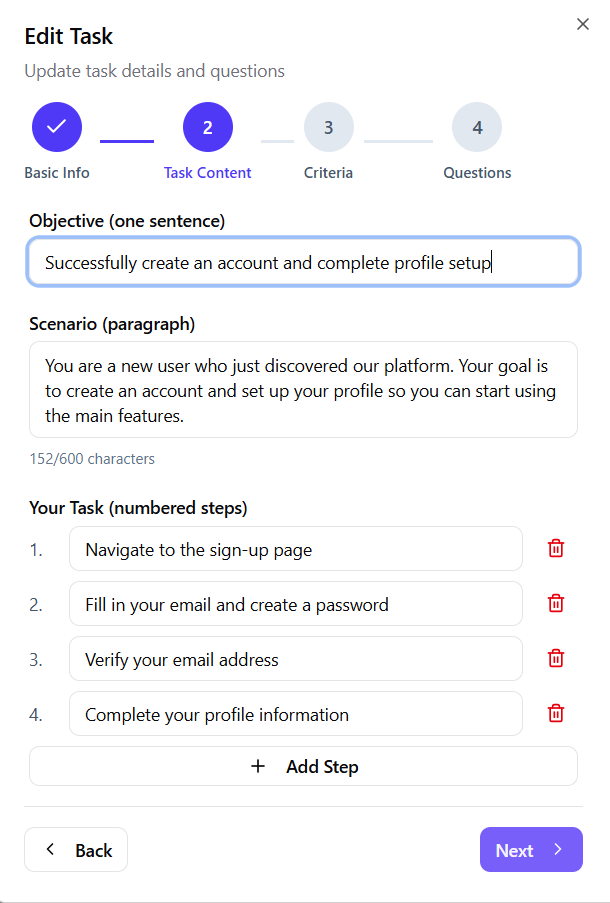
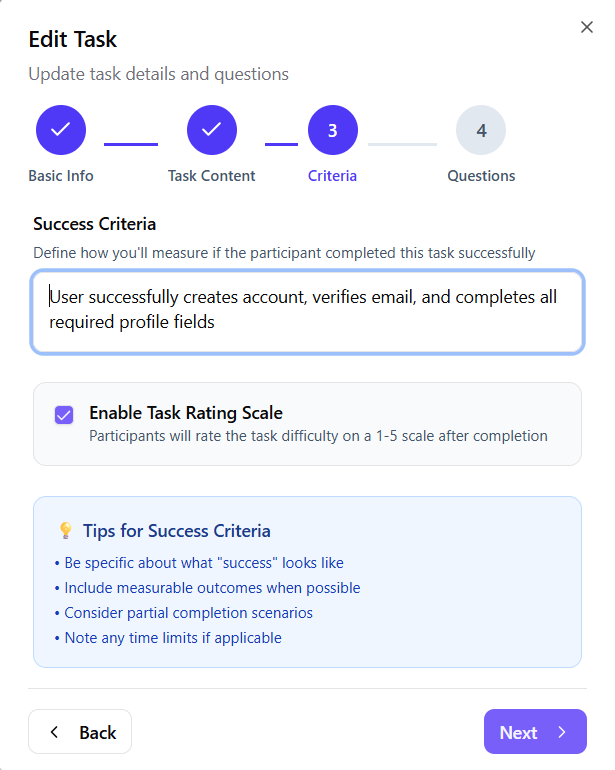
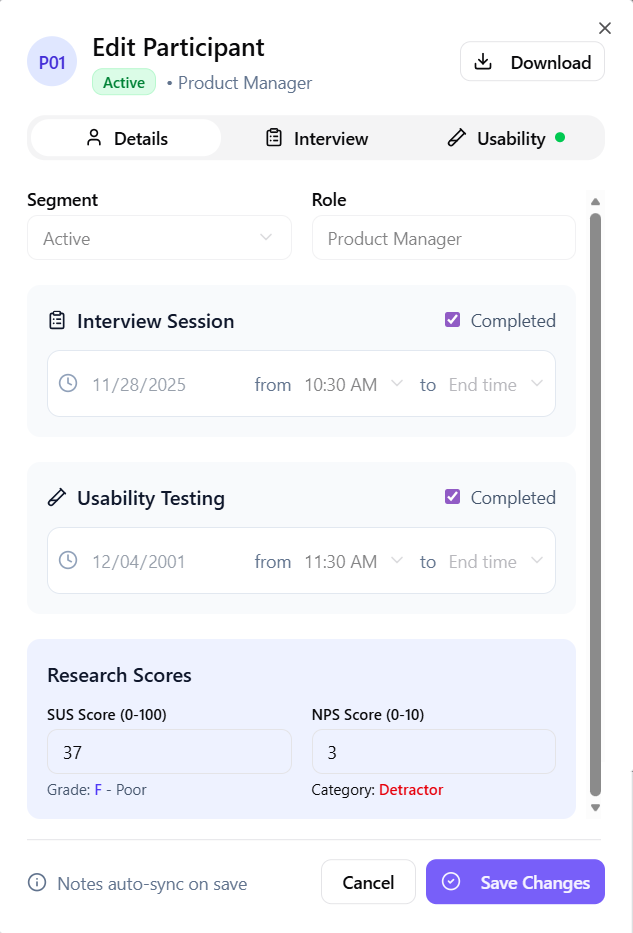
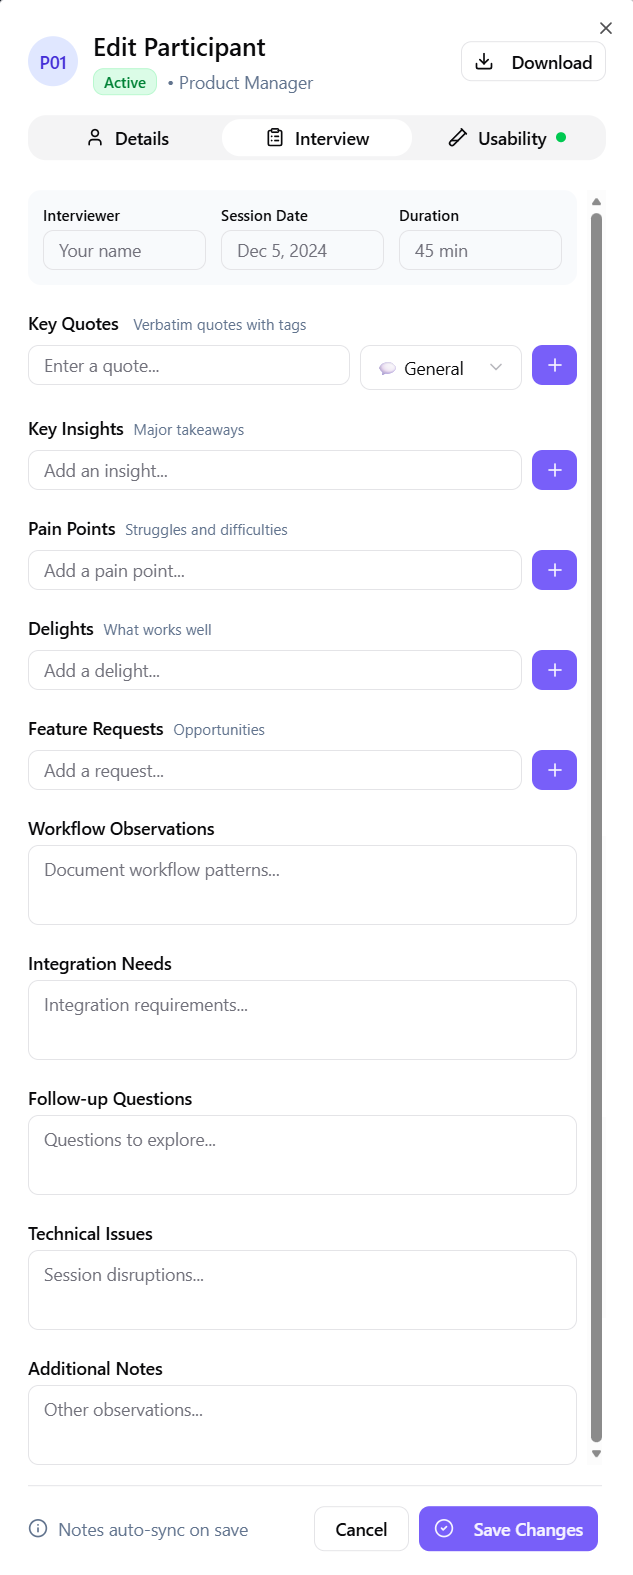
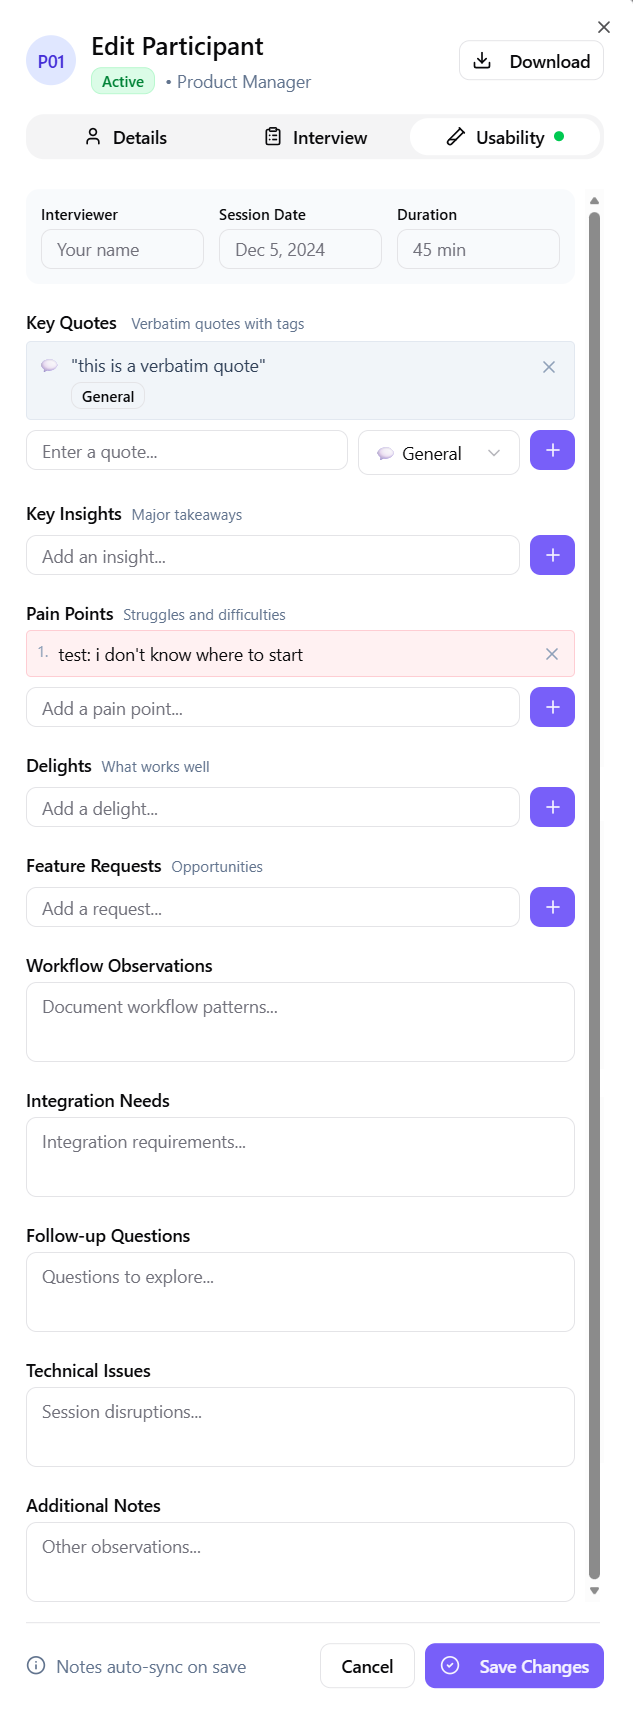
Edit Modals
Clicking Edit on a participant, task, or hypothesis opens a modal dialog.
Participants Tab
Tasks Tab
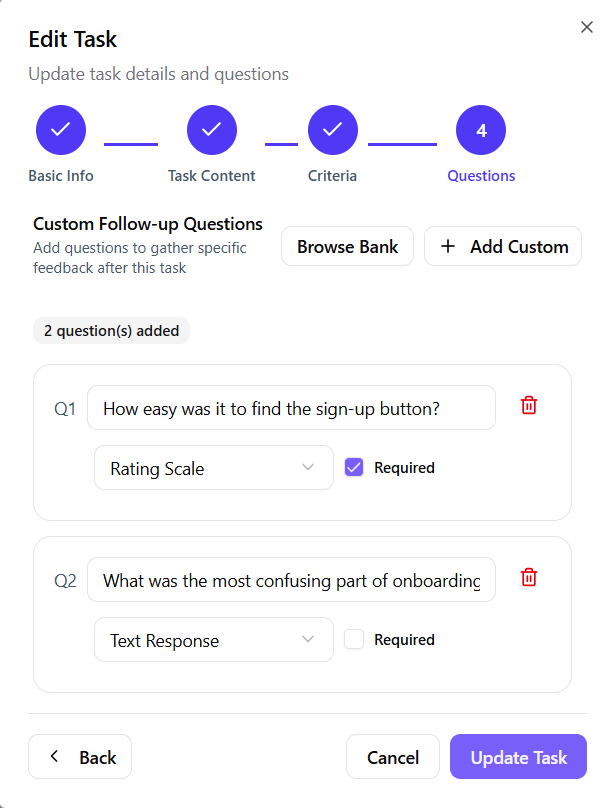
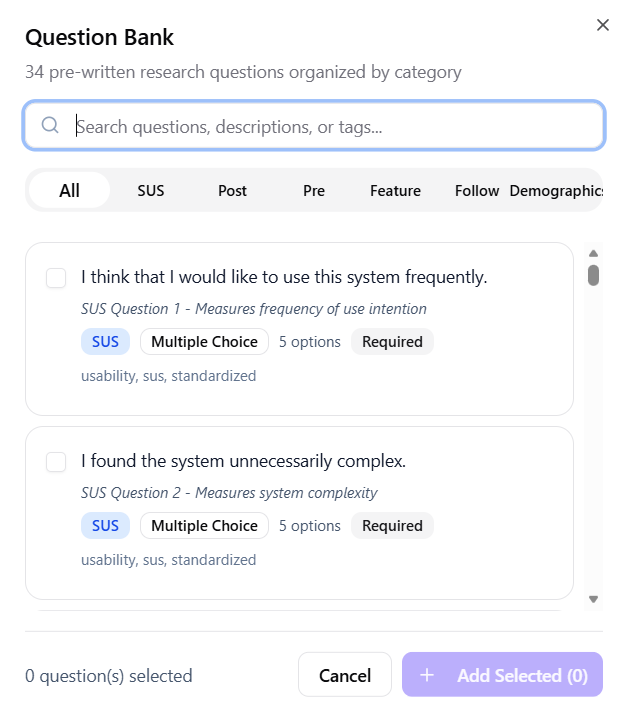
Question Bank
Synthesis Tab
Next Steps
Now that you know your way around:
- Create your first project with a hands-on tutorial
- Learn the key concepts behind the interface
- Explore how-to guides for specific tasks